Many early move-outs in senior living are preventable. In this blog, we cover where some residencies end earlier than planned, and what operators can do to prevent leakage.
Every senior living operator watches one number more closely than almost any other figure on the P&L. In the United States the industry calls it census; in the United Kingdom, occupancy. Senior housing occupancy is the share of a community’s units or beds that are filled, and it determines whether the business is sustainable, because an empty unit carries nearly the full fixed cost of an occupied one.
A meaningful share of the move-outs that drain it are preventable with levers operators already hold such as a defined post-fall protocol, attention concentrated on the overnight hours where risk peaks, and evidence that prompts reassessment before a crisis rather than after one.
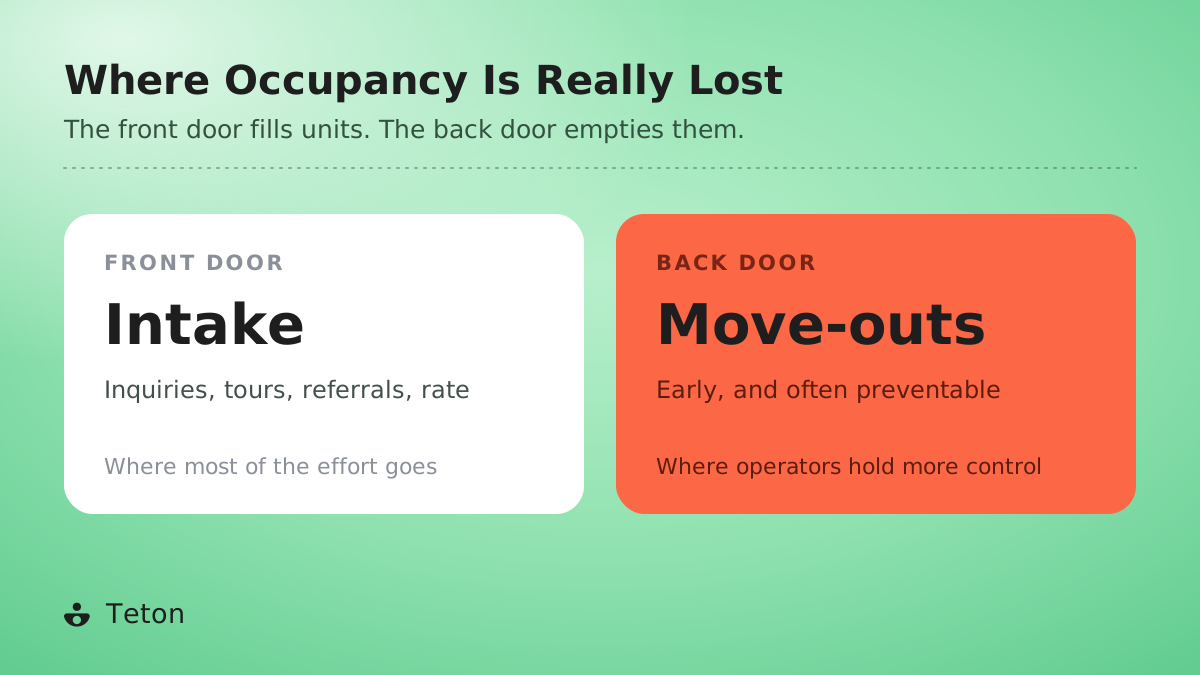
Many operators manage occupancy at the front door via inquiries, tours, referral relationships and rate strategy. The argument of this piece is that occupancy is also lost at the back door, through residencies that end earlier than anyone planned, and that the back door is where operators hold far more control.
What drives senior housing occupancy?
The conventional drivers are real. Local demographics and new supply set the ceiling, which is why NIC occupancy data moves with construction cycles. Reputation, ratings, and referral relationships shape inquiry flow. Rate strategy and care mix determine which inquiries convert and what each unit earns. The same logic holds in the UK, where care home occupancy is tracked through official adult social care statistics and analysis such as the Nuffield Trust’s work on bed availability.
These numbers matter, and the margin math behind them is unforgiving. A community running in the low eighties is often operating near break-even, which is why census sits at the top of every meeting agenda. What the market data cannot show is where individual communities lose the residents they already have.
Why residencies end earlier than planned
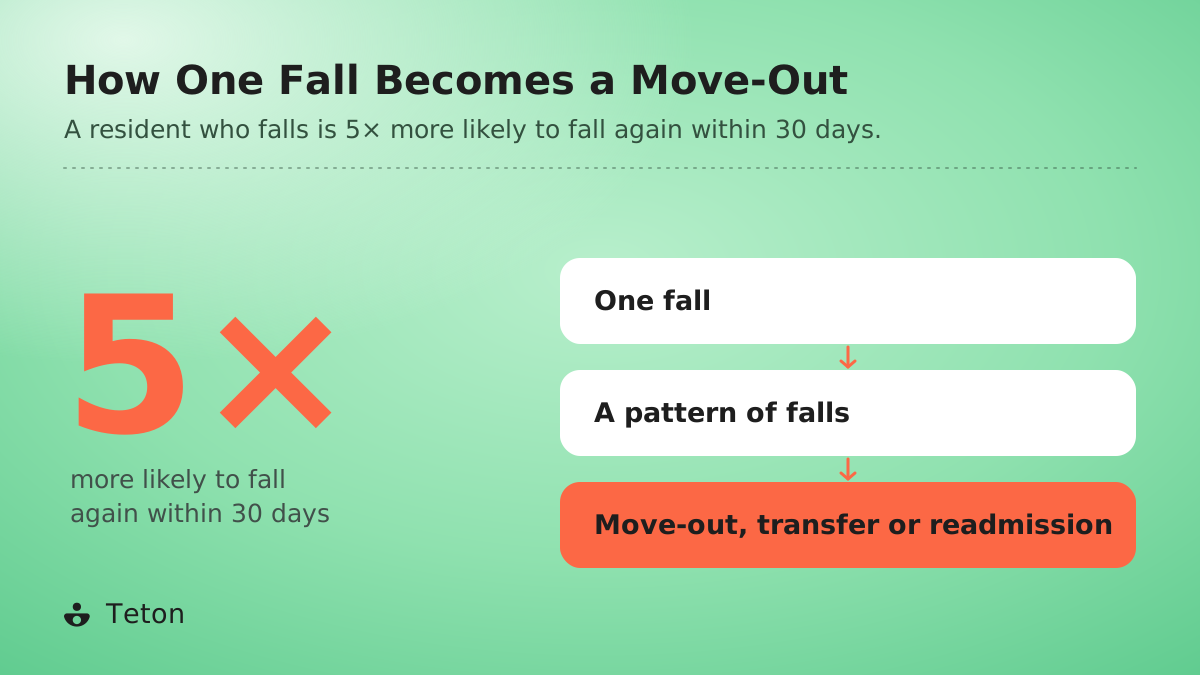
Residencies end both for reasons no operator controls, and for reasons operators can influence. The largest controllable category is the cascade that follows a fall: the injury, the hospital transfer, the deconditioning that follows a hospital stay, and the family conversation about whether the community can still meet mom’s needs. Tetons’ analysis across four countries, published in Anatomy of 2,000 Falls, found that a resident who falls is around five times more likely to fall again within 30 days, which is how one incident becomes a pattern, and a pattern becomes a move-out, a transfer to skilled nursing, or a readmission cycle.
Undetected decline works the same way at a slower speed. Deteriorating sleep, reduced mobility, and rising overnight restlessness often precede the infection or crisis that ends a residency, and none of it is visible in a quarterly review. In the UK the same dynamic runs in the other direction too. A home that cannot evidence its ability to manage complex residents safely will find hospital discharge teams routing placements elsewhere.
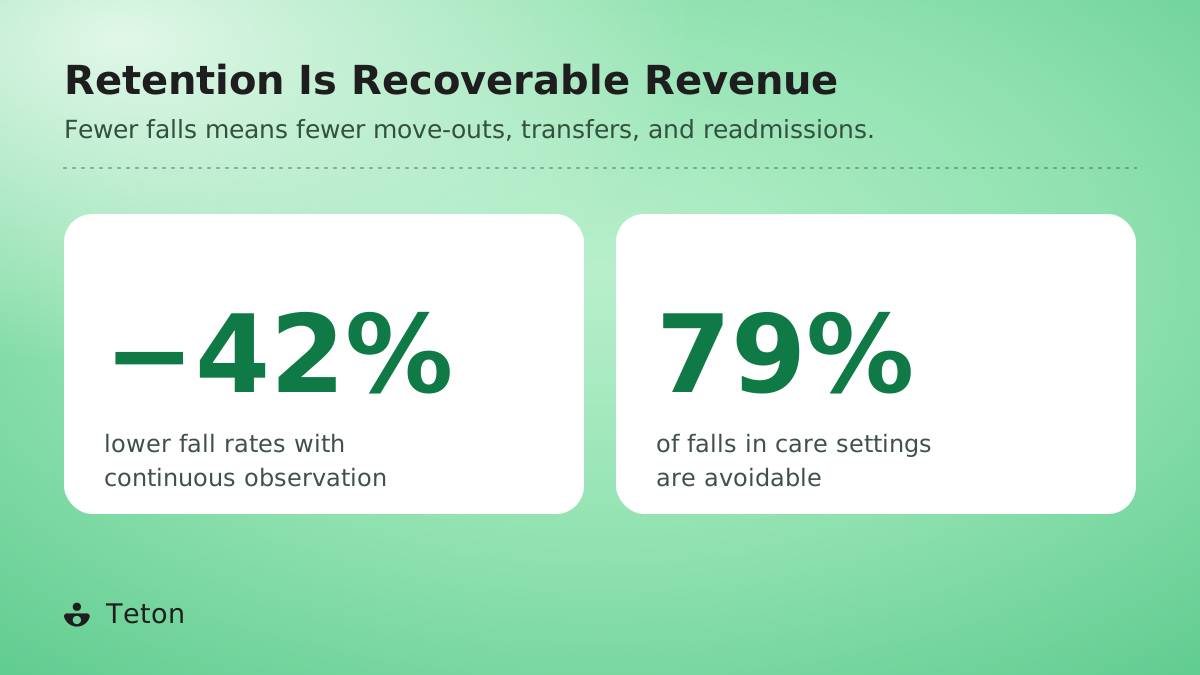
The same analysis concluded that 79 percent of falls in care settings are avoidable. Read through an occupancy lens rather than a clinical one, that figure describes recoverable revenue.
What should an occupancy audit look at?
Occupancy reviews usually concentrate on the funnel such as inquiry volume, conversion, tour quality, and time to move-in. A back-door audit asks different questions. How many residencies ended early in the last year, and what preceded each one? What does the incident pattern look like overnight, when risk concentrates and staffing is thinnest? Is there a defined post-fall protocol with an owner and a review cadence, or does vigilance fade informally?
Staffing sits inside this audit rather than beside it. Ratios and care plans are built on assessments, and assessments age. The same 25 residents can require materially different attention from one month to the next as dependency shifts. A schedule built on last quarter’s acuity ages exactly the way the assessments do. The more useful audit question is whether attention concentrates where risk is actually rising, and whether the community can evidence that to families, referrers, and regulators.
Retention is the occupancy strategy
Filling units faster than they empty is a treadmill, and the communities that step off it are the ones that slow the emptying. Continuous, passive room sensing now makes the back door measurable. It can show the restlessness, the night bed exits, and the pattern changes that precede incidents, and prompt reassessment while intervention is still possible. Communities in the 2,000-fall analysis cut fall rates by 42 percent.
The commercial effect shows up in the conversations that decide occupancy. A family touring after a parent’s fall at home asks how the community would know if it happened again. A discharge planner placing a complex patient asks for evidence rather than assurance. Communities that can answer those questions with their own data win more of those decisions, and keep more of the residents they have already won.
The strongest position an operator can take is to treat retention as the first occupancy lever rather than the last. The market sets demand. The front door sets intake. What happens at 3 a.m. on an ordinary Tuesday sets how long each residency lasts, and that is the part of the number an operator actually owns.
See what the data shows
This piece draws on Teton’s analysis of 2,000 confirmed falls and 3 million movement transitions, published in Anatomy of 2,000 Falls. To see how continuous observation supports retention alongside your sales work, book a demo.