Our previous blog explained how Teton reconstructs the resident's room in 3D from a single ceiling-mounted sensor. This is what that understanding enables for care teams and the operators running communities.
← Back to blog
Teton Explained
How Teton Understands Each Resident
From a continuously updated 3D digital twin, Teton monitors sleep, mobility, respiration, and activity for every resident, surfacing gradual change before it becomes a crisis.
May 15, 2026
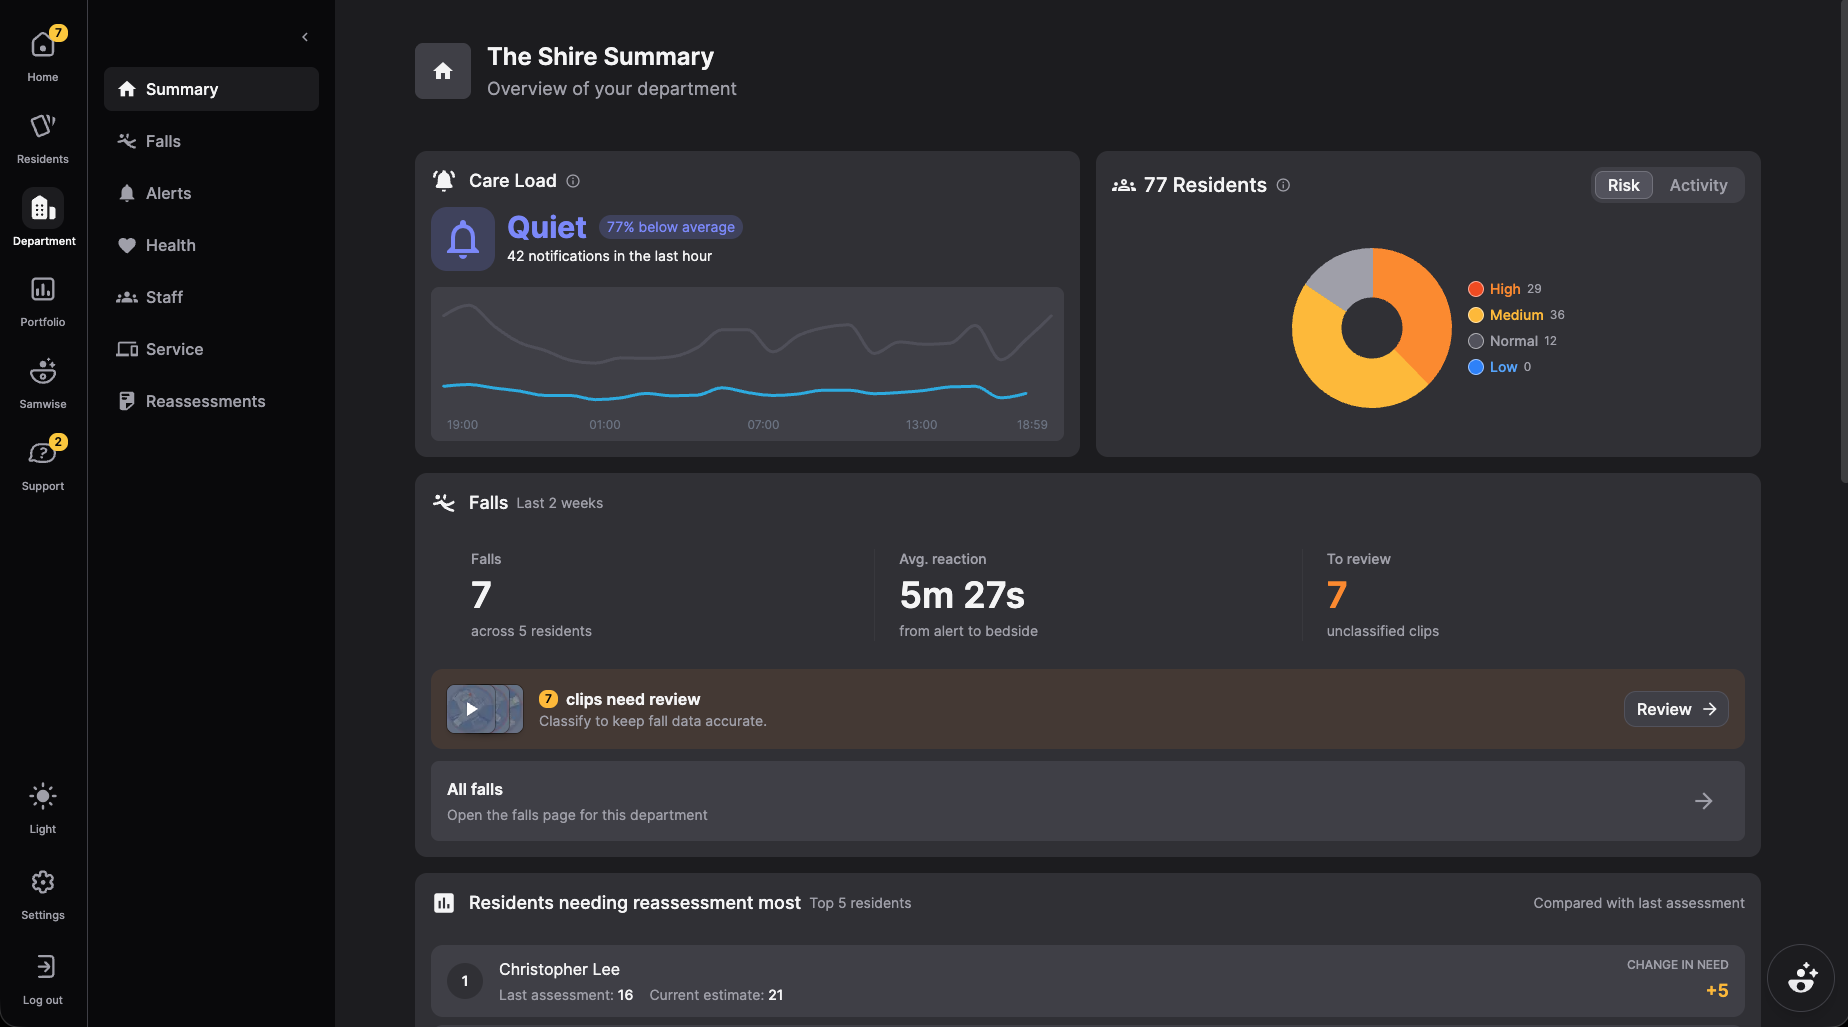
With Teton, care staff get a live overview of every resident in the ward from a single view. Each resident's current activity is represented by their state: lying in bed, sitting in a chair, walking with an aid. Where a staff member is already present with a resident, that is visible too. Each resident card also reflects their individual risk settings, so the team can see at a glance who needs attention. The department view below shows this in practice.
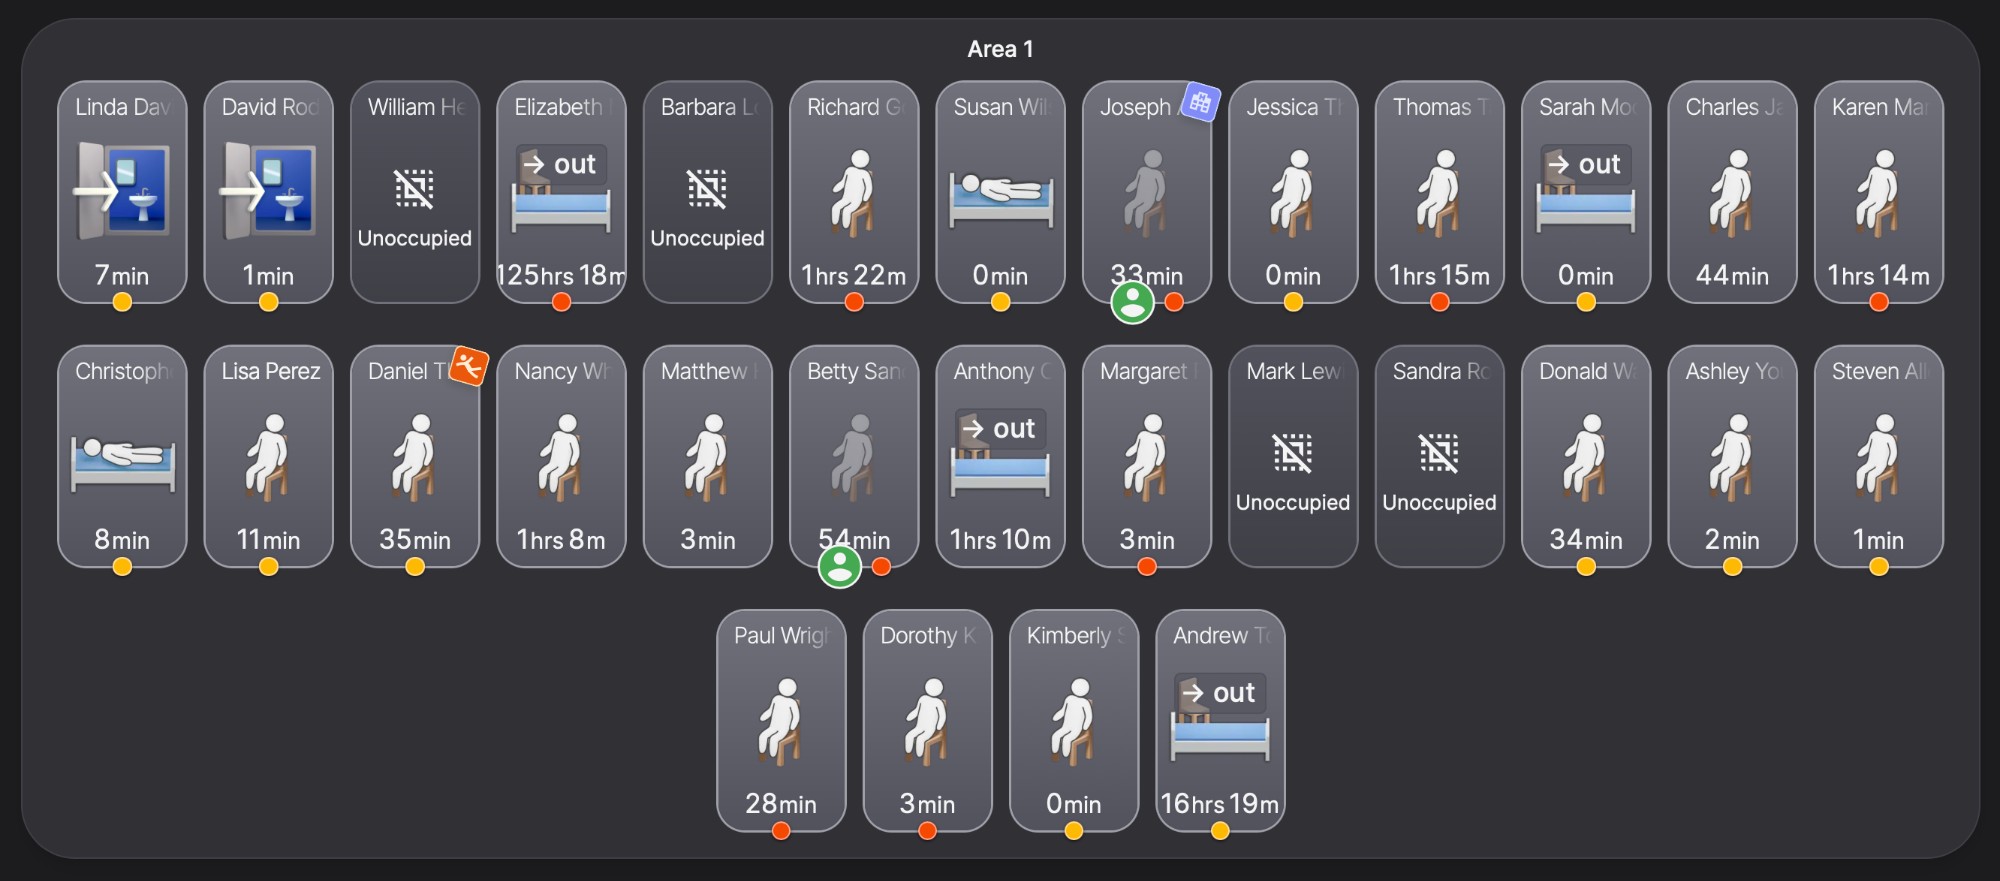
Resident names and data shown are fictional and used for illustrative purposes only.
Teton does not identify residents by face or personal identity. The system links activity to the resident assigned to that room, observing movement, posture, and location zones within the space. All processing happens on-device where images are processed and deleted. What reaches care staff is the output about each resident such as an alert, their behavioral state or a pseudonymized clip of a fall. Nothing identifiable is ever transmitted.
From digital twin to health signals
In Part 1, we explained how Teton builds a digital twin, a continuous, real-time 3D reconstruction of the resident's room, updated multiple times per second, entirely on-device.
From the digital twin, Teton monitors sleep patterns, mobility, respiration, and activity continuously, without wearables and without interrupting daily life. These signals build a longitudinal picture of each resident's behavior over time, forming the basis for care decisions that improve quality of care, reduce clinical risk, and give operators objective data to demonstrate the standard of care being delivered.
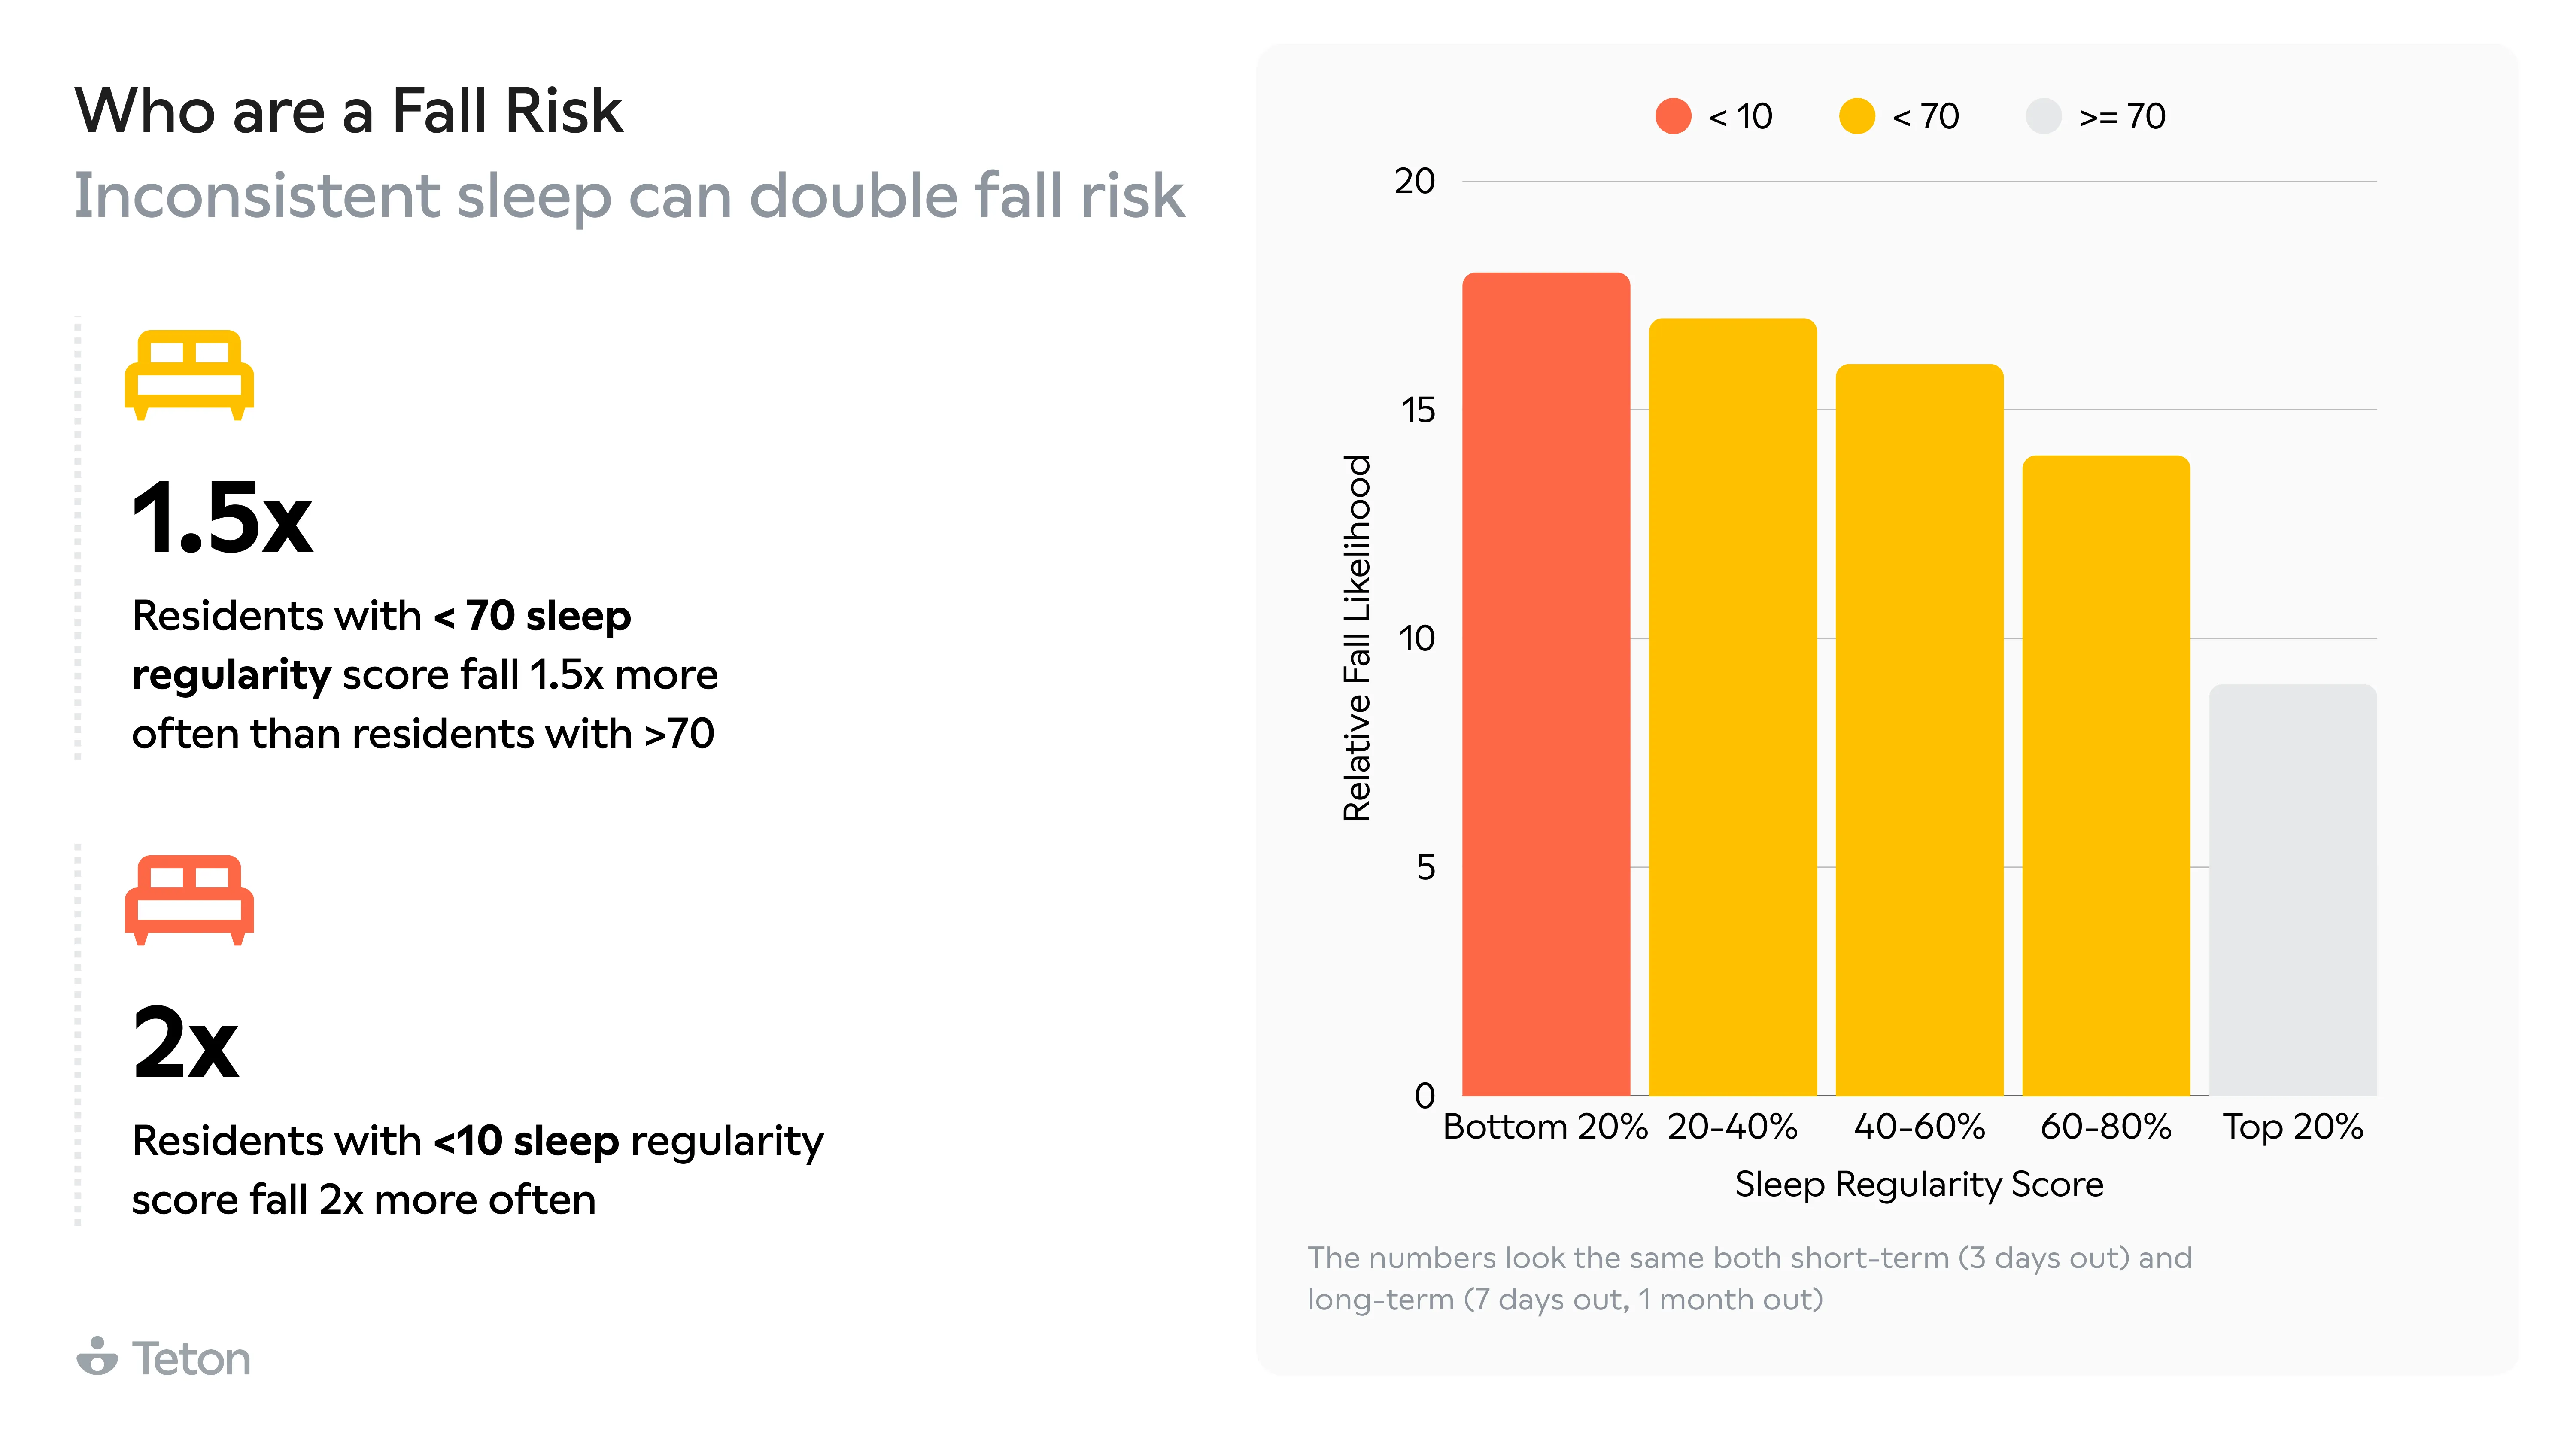
Our Anatomy of 2,000 Falls highlighted how these signals have a direct and measurable relationship with fall risk. For instance, residents with low sleep regularity scores fall up to twice as frequently as residents with consistent patterns.
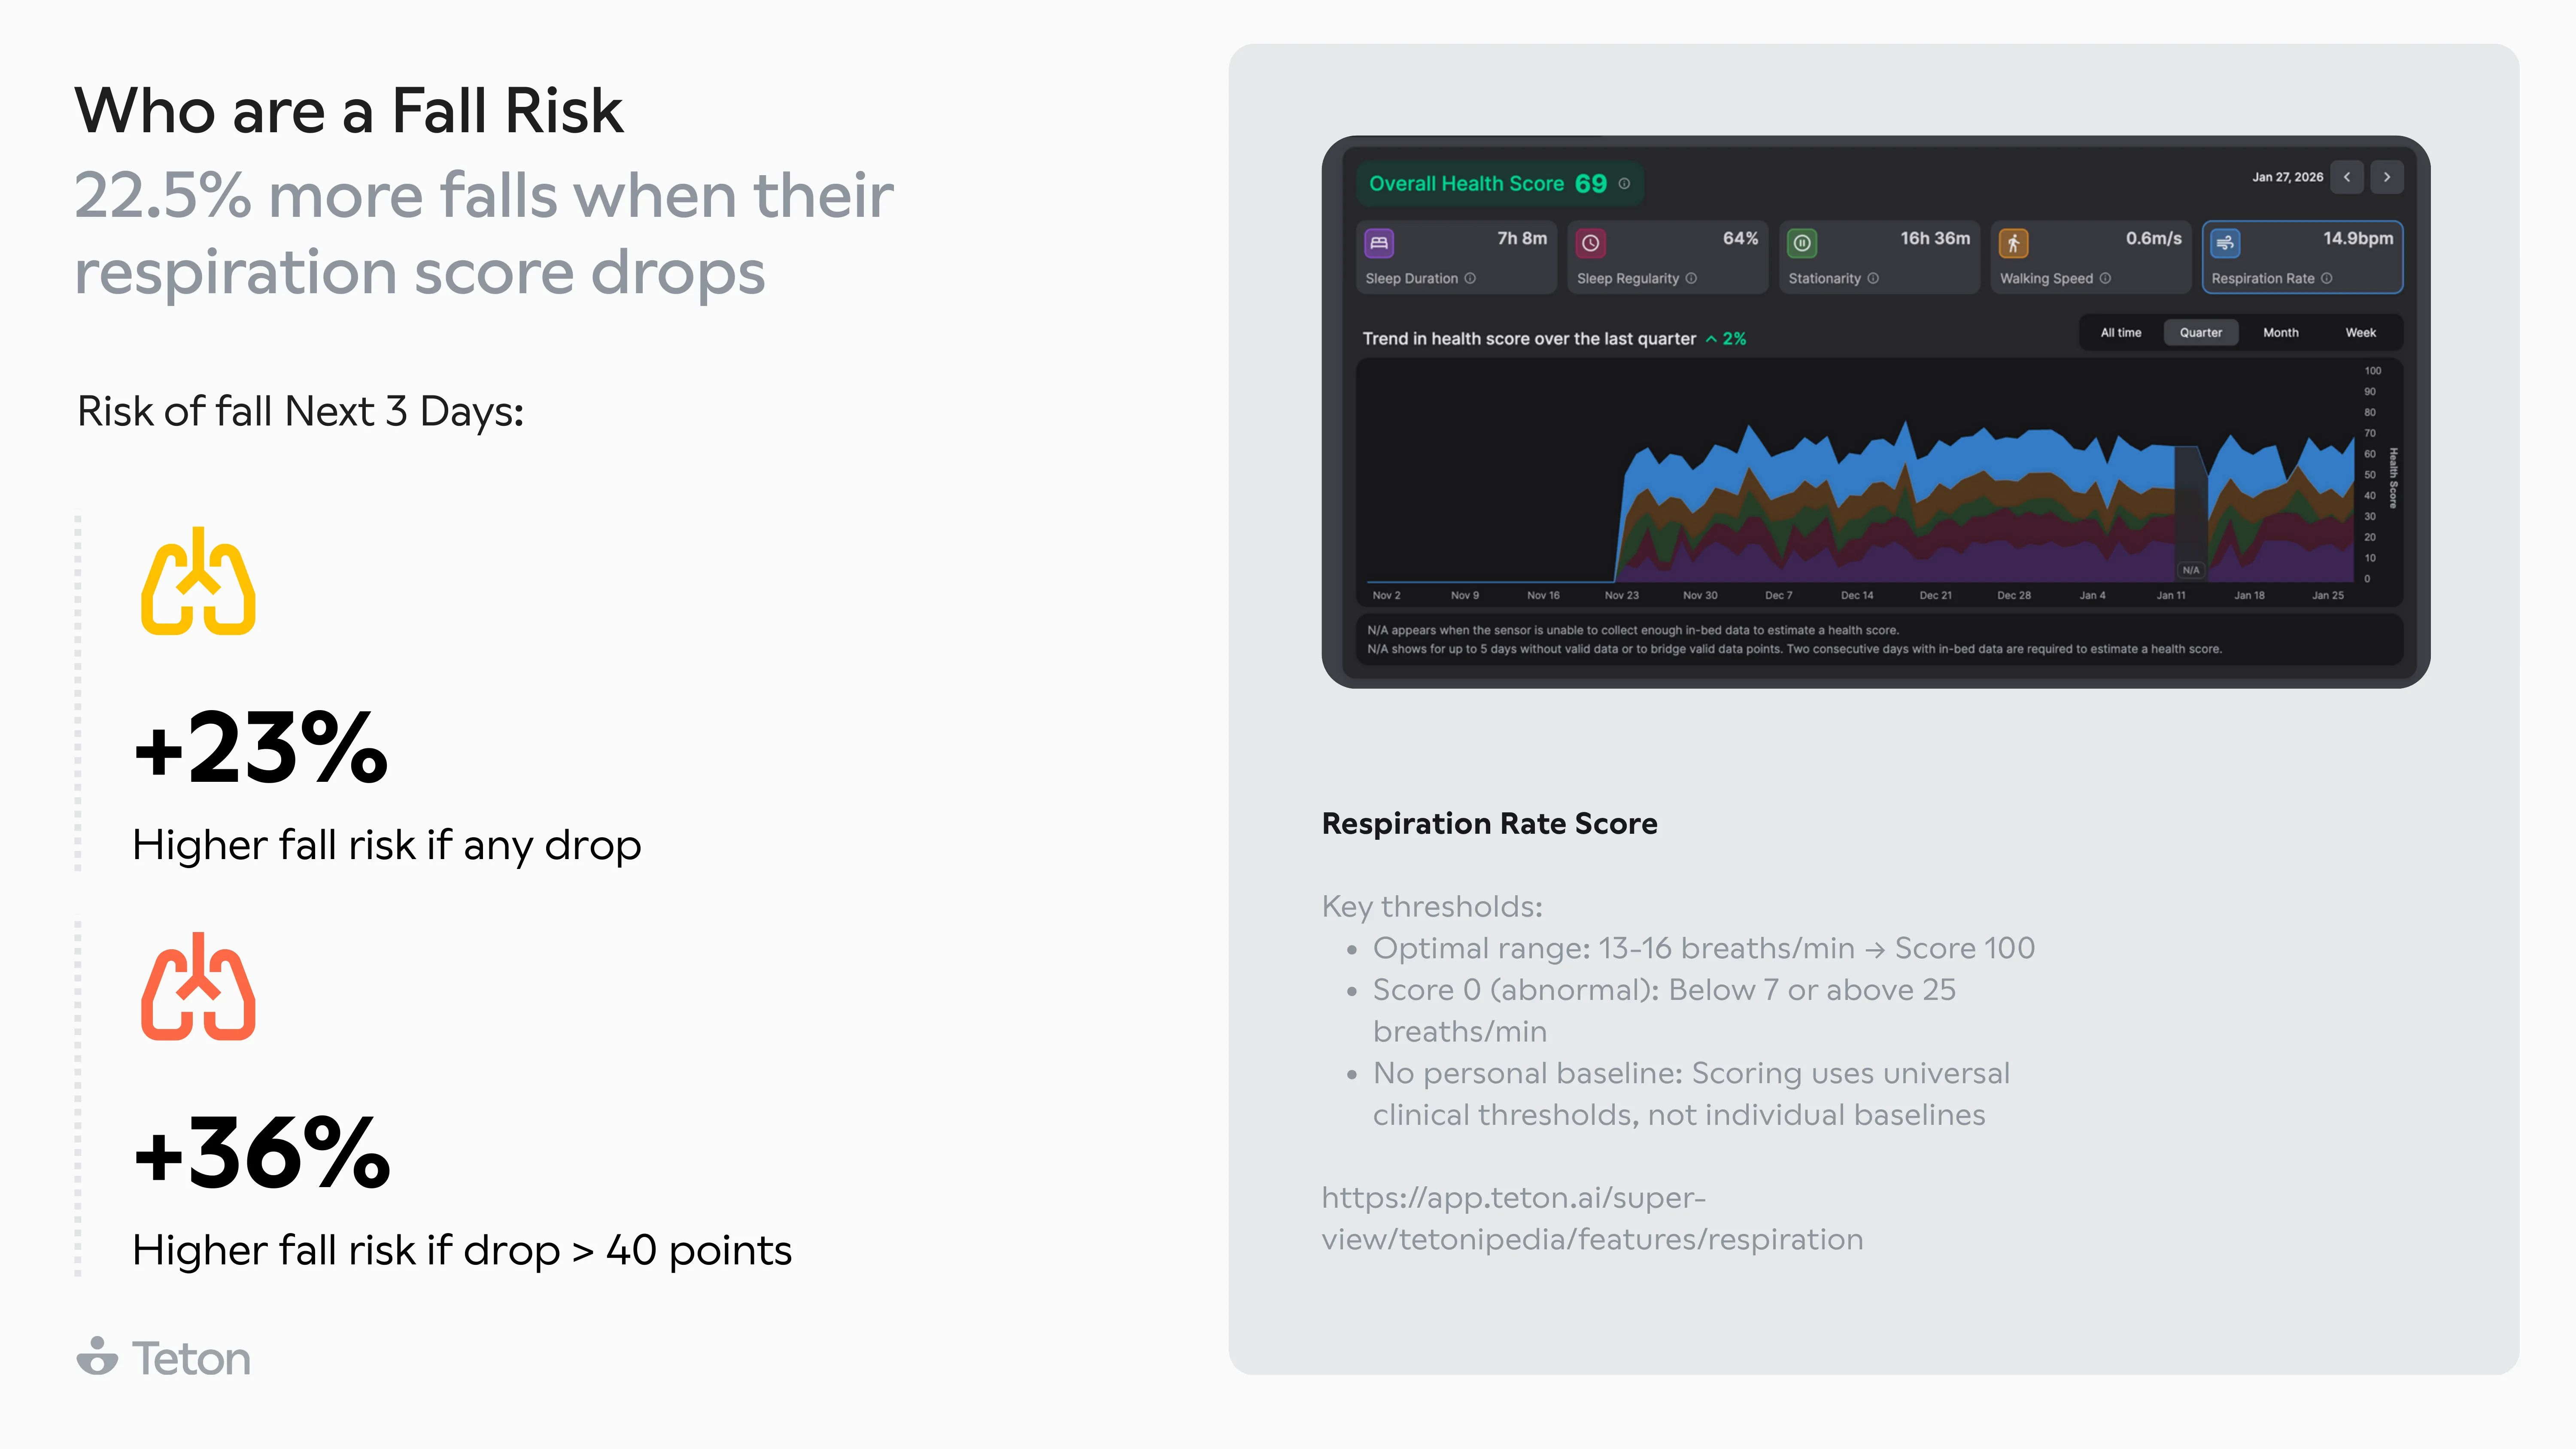
Respiration tells a similar story. When a resident's overnight breathing rate starts rising from their normal baseline, fall risk increases by 23% within the next three days. A significant shift pushes that to 36%. These are not traditional fall risk factors which appear on a standard assessment checklist. But they are measurable and surface early, and the Teton sensor captures both of them.
How gradual change becomes visible
Without continuous monitoring, significant changes in a resident's health rarely announce themselves clearly. A slowing gait, disrupted sleep, and reduced activity are each easy to miss in isolation. Over time, the pattern tells a different story.
A baseline period is our system's understanding of what is normal for that specific resident, built from their own continuous data rather than a population-wide average. Because Teton monitors each resident against their own baseline, subtle shifts surface in the data before they become visible to the human eye.
This matters more than it might appear. Residents who have had a fall in the last three months are five times more likely to fall again in the next thirty days. Where alert settings are configured to respond automatically, the system adjusts monitoring sensitivity after a fall and keeps it elevated. Care teams can act earlier, reducing the likelihood of a deterioration becoming a crisis, a hospital admission, or an adverse incident that carries compliance and legal risk for the operator.
Our recent research also found that 79% of falls in care settings are avoidable. Closing that gap requires skilled care teams working with the right information, the right alerts configured for each resident, and systems that reach the right people in time.
These gradual changes are clearly highlighted to staff in the resident card, as shown below.
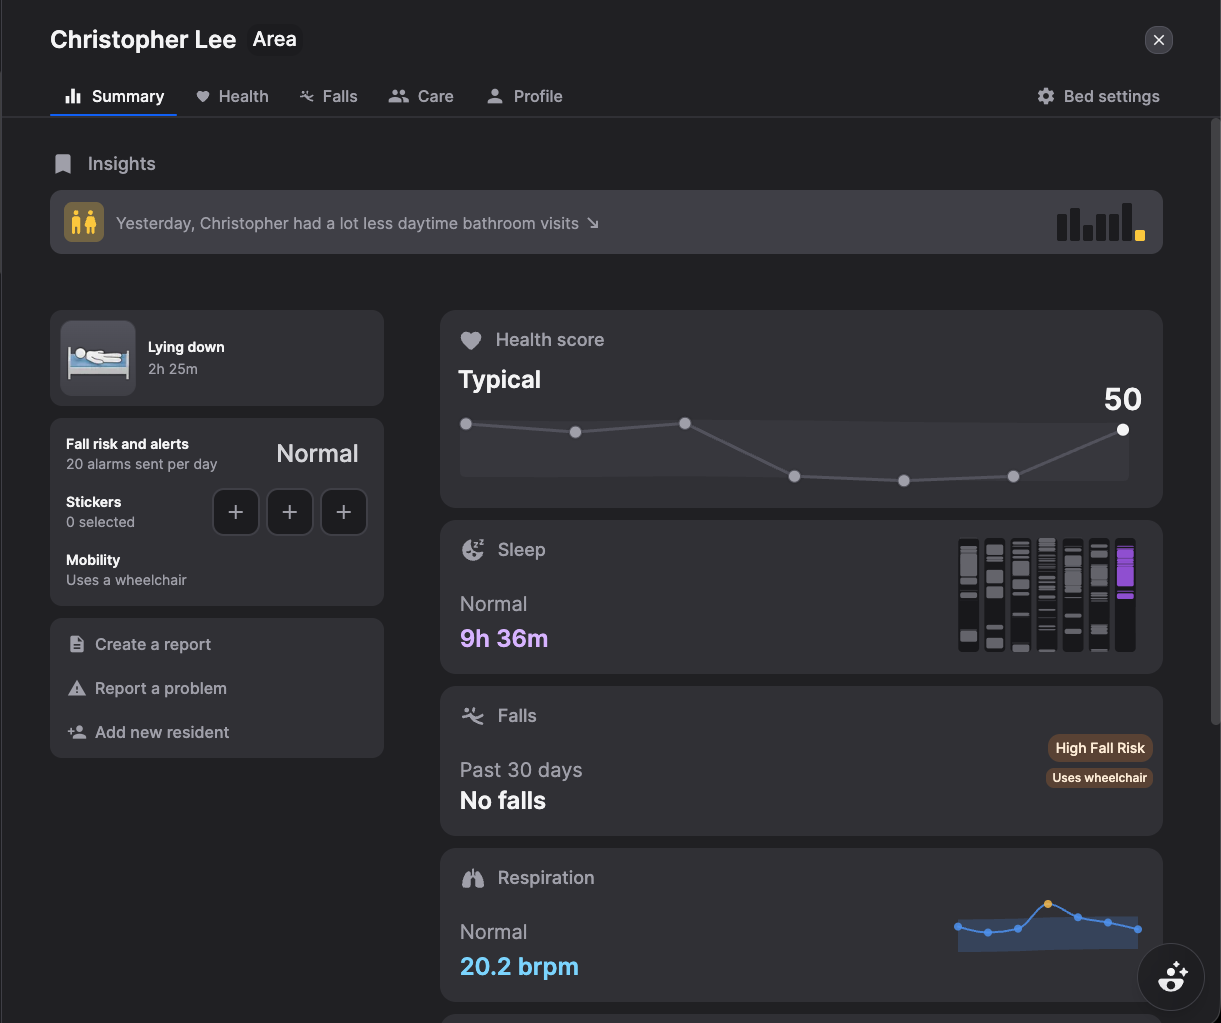
Resident names and data shown are fictional and used for illustrative purposes only.
What staff see
On the resident card, staff see the resident's current activity state and how long it has been ongoing, covering states such as lying in bed, sitting on the bed edge, standing, walking with a walking aid, and being in the bathroom. A real-time picture of every resident across the department, without physically entering each room.
This visibility directly supports staffing optimization. Care teams spend less time on manual rounds and more time responding to residents who actually need attention. The department summary below gives operators a snapshot of care load and risk across the whole ward.
Resident names and data shown are fictional and used for illustrative purposes only.
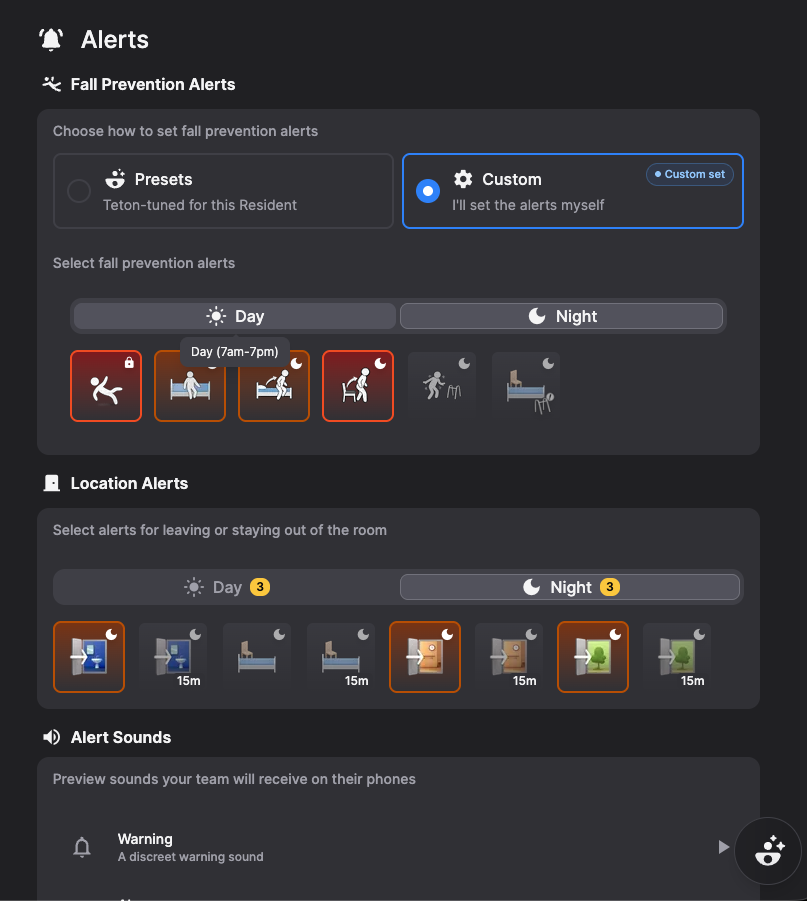
Teton includes a notification system that allows care staff to configure which alerts on resident activity they receive. Each team knows their residents. The settings let them tell the system what matters for each individual, so it flags the right things at the right time.
Notification settings are configured per resident, not as a single rule across the department. Each behavior can be set as silent, an alert, or an alarm depending on what is normal for that individual. Falls are alarms by default but everything else is determined by the care team that knows the resident.
This matters because risk is not uniform. Walking aid users make up 32% of residents but account for 52% of all falls, and two thirds of those falls happen when the aid is not being used. An alert configured around walking aid behavior for a high-risk resident is not a generic notification but is a targeted intervention informed by data.
This level of customization reduces notification fatigue, keeps staff focused on genuine priorities, and creates a documented record of how care decisions are being made, which supports compliance and reduces legal exposure for operators.
Care continuity
Staff can attach care notes directly to resident activity, documenting observations and flagging concerns alongside the data already captured. Notes carry across shifts, so the team coming on has the same picture as the team going off.
This directly affects how quickly staff can respond when something happens. Teton communities have seen up to a 93% reduction in response time to falls, with one community reducing average reaction time from over 2,220 seconds to 156 seconds. That is not just a care quality outcome. Faster, documented responses reduce liability exposure, support audit readiness, and give operators the evidence they need to demonstrate the standard of care being delivered to regulators, families, and commissioners.
The complete picture
When care teams have a complete, continuous record of every resident across every shift, the gap between what is known and what is acted on closes. That is what care continuity makes possible.
For operators, this is what continuous understanding looks like in practice. Objective data on every resident, across every shift, without placing any burden on the people living in the building.
See how Teton monitors every resident, continuously